How JetBrains Rider Implemented .NET WebAssembly Debugging


Blazor is part of a .NET technology that lets you build full-stack web applications using C# without the need to write JavaScript code. There’s server-side Blazor, client-side Blazor (which uses WebAssembly (WASM) to run in the browser and interact with the DOM), and other hosting models.
Our .NET IDE, JetBrains Rider, helps you develop Blazor applications. You can write code and use the debugger to run and troubleshoot the apps you are developing. While the process of implementing a debugger is more or less the same for Blazor Server as it is for any other .NET application, the debugger implementation for Blazor WASM is quite different.
In this blog post, we’ll look at some of the finer engineering points of how we implemented the IDE frontend for debugging both Blazor WASM and all variations of .NET apps targeting WebAssembly!
The .NET WebAssembly family
Before Blazor, there were several other well-known and more obscure frameworks, both from Microsoft and third-party authors, that allowed users to run .NET in the browser. For example, there is OpenSilver, an open-source implementation of the now deprecated Silverlight. For a while, there was also a Bridge.NET framework.
With Blazor, Microsoft released the first first-party framework for .NET in the browser using WebAssembly technology. Blazor WebAssembly can be used to develop Single-Page Applications (SPAs). These can be hosted by the DevServer that is part of the .NET SDK, or as part of an ASP.NET Core backend running server-side APIs to build full-stack applications with .NET.
When .NET 7 was released, two new options appeared as part of the new SDK’s wasm-experimental workload: the browser-wasm and console-wasm runtime identifiers (RID). These let you target WASM in the browser with Blazor, and NodeJS in the terminal for other .NET application types.
Based on the Wasi.Sdk prototype created by Steve Sanderson, .NET 8 will include another workload that targets the WebAssembly System Interface (WASI), which will make it possible to run .NET code through WebAssembly outside of the browser while maintaining access to the file system, network, system calls, and more.
Tip: Our developer advocate Khalid Abuhakmeh covered a number of these options in the Future of .NET with WASM.
Typically, these approaches use the Mono Ahead of Time (AOT) compiler to generate WebAssembly binaries. There’s an experimental NativeAOT-LLVM project by the .NET team that uses the Emscripten toolchain, but it is currently not ready for use in real projects.
Anatomy of a .NET WebAssembly application
Let’s look at how .NET applications targeting WebAssembly are composed. We’ll start with Blazor WASM and then dig into the wasm-experimental workload.
Blazor WASM
When creating a Blazor WASM application, you will find an index.html file which, like in most other SPA frameworks, contains a div element in which the framework will create and render your application. There will also be a script element that loads the Blazor WebAssembly framework:
<!DOCTYPE html>
<!-- ... -->
<body>
  <div id="app">
    // ...
  </div>
  // ...
  <script src="_framework/blazor.webassembly.js"></script>
</body>
</html>
After building this project, you will see that several files are created:
BlazorApp1.dllandBlazorApp1.pdb– A compiled version of your application.blazor.boot.json– Contains information about the entry assembly (BlazorApp1) and information about the runtime, dependencies, and so on.dotnet.wasm– A version of the .NET runtime (Mono, to be more precise) compiled into a WebAssembly module.mscorlib.dll– The .NET framework core libraries, compiled into Common Intermediate Language (CIL).blazor.webassembly.js– A file that glues all of the above together.
If you run this application using the dotnet run command, for example, you’ll see a dotnet process begins. This then starts (by default) the DevServer and hosts your application, which you can work with through the browser:
dotnet run
└── dotnet: "~\.nuget\packages\microsoft.aspnetcore.components.webassembly.devserver\7.0.5/tools/blazor-devserver.dll" --applicationpath "...\BlazorApp1\bin\Debug\net7.0\BlazorApp1.dll"
Now let’s see how the wasm-experimental workload handles this.
wasm-experimental
To try out the wasm-experimental workload, you’ll first need to install it:
dotnet workload install wasm-tools wasm-experimental
Once done, you can create a new .NET application using the wasmbrowser template:
dotnet new wasmbrowser --name WasmApp1
Like with Blazor WASM, an index.html file is created with a span element used for rendering. The HTML file also loads the main.js file as a script, not a Blazor framework-related script like in the previous example.
<!DOCTYPE html>
<html>
<head>
  <!-- ... -->
  <script type='module' src="./main.js"></script>
</head>
<body>
  <span id="out"></span>
</body>
</html>
The main.js that is loaded is very different from the Blazor approach, where there’s little control over how the application is launched. In the main.js, we can see that .NET is imported, some other code is executed, and finally, dotnet.run() is invoked to start the application.
import { dotnet } from './dotnet.js'

// ...

await dotnet.run();
The ... in the above code snippet is important. During startup, you can change the .NET (well, Mono) runtime configuration, such as network download policy settings and more. When using WebGL, for example, you can specify the canvas for rendering. You could also change the logging level, which may be useful for seeing what’s going on when you are porting your application to .NET WebAssembly.
After building this project, you’ll find that several files are created:
mono-config.json– Metadata generated from your project, specifying the main assembly name, assembly folder, debug level, sources, asset hashes, and more.managed/(folder) – Your application’s managed assemblies.dotnet.jsanddotnet.js.symbols– JavaScript-based APIs to configure and manipulate the Mono runtime together with debug symbols.dotnet.wasm– A version of the .NET runtime (Mono, to be more precise) compiled into a WebAssembly binary.index.htmlandmain.js– The files we saw earlier, bootstrapping your application.WasmApp1.runtimeconfig.json– A runtime configuration file, which is required sincewasm-experimentalprojects add a new runtime identifier.
The WasmApp1.runtimeconfig.json contains metadata for the runtime to help determine how the application should be run. It specifies the main assembly, runtime arguments if needed, and an index.html file that will be run in the browser.
{
  "runtimeOptions": {
    "tfm": "net8.0",
    "wasmHostProperties": {
      "perHostConfig": [
        {
          "name": "browser",
          "html-path": "index.html",
          "Host": "browser"
        }
      ],
      "runtimeArgs": [],
      "mainAssembly": "WasmApp1.dll"
    },
  }
}
To run the application, you can invoke dotnet run again. In the process tree, you’ll notice WasmAppHost as the application (and not the DevServer from earlier):
dotnet: run
└── dotnet: exec "C:\Program Files\dotnet\packs\Microsoft.NET.Runtime.WebAssembly.Sdk\8.0.0-preview.4.23259.5\WasmAppHost\WasmAppHost.dll" --runtime-config "D:\Playground\WasmApp1\WasmApp1\bin\Debug\net8.0\browser-wasm\AppBundle\WasmApp1.runtimeconfig.json"
In summary
Whether you use Blazor WASM or the wasm-experimental workload, almost any .NET WebAssembly application runs with the Mono runtime. It’s important to note, however, that even though you specified a compatible version of the language and the target framework, some C# functionality that you compile will not be understood by the runtime. A good example is generic types in attributes, introduced in C# 11. You can use such an attribute in your code, but at the time of writing this post, it is not supported by the Mono runtime and fails to execute.
Note: Generic attributes in Mono will work starting from .NET 8.
In addition to the Mono runtime, we saw that your application will be hosted with the DevServer, the WasmAppHost, or on ASP.NET Core. You will find an index.html file that is opened in the browser, as well as some JavaScript glue code.
Now, how does the debugger in Rider communicate with the runtime? And how does the runtime itself communicate with the browser (and vice versa)? Let’s find out!
Debugging a .NET desktop application
Before we dive into debugging .NET WebAssembly applications, let’s take a quick detour and talk about debugging a .NET desktop application. There are three actors involved in this process – a runtime (which runs your application’s code), the debugger client (Rider), and your application. When the runtime starts, it waits for the debugger to connect to it, and then continues executing the code.
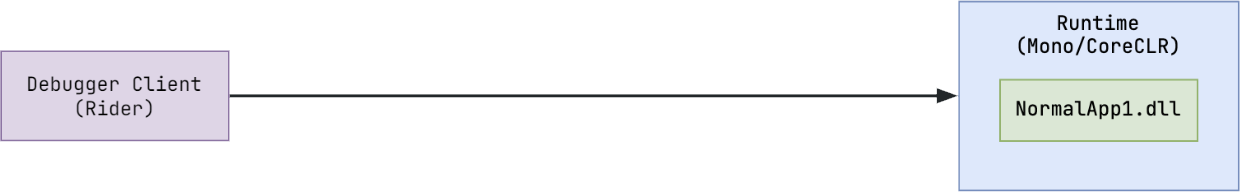
When debugging locally, with both the debugger and your application on the same machine, the debugger client is almost always in the same environment as the runtime, so the lifetimes of both actors are closely related. When you close your application, the debugger knows it can stop running.
For .NET WebAssembly applications, the debugger’s and debuggee’s lifetime (your application) becomes more… interesting.
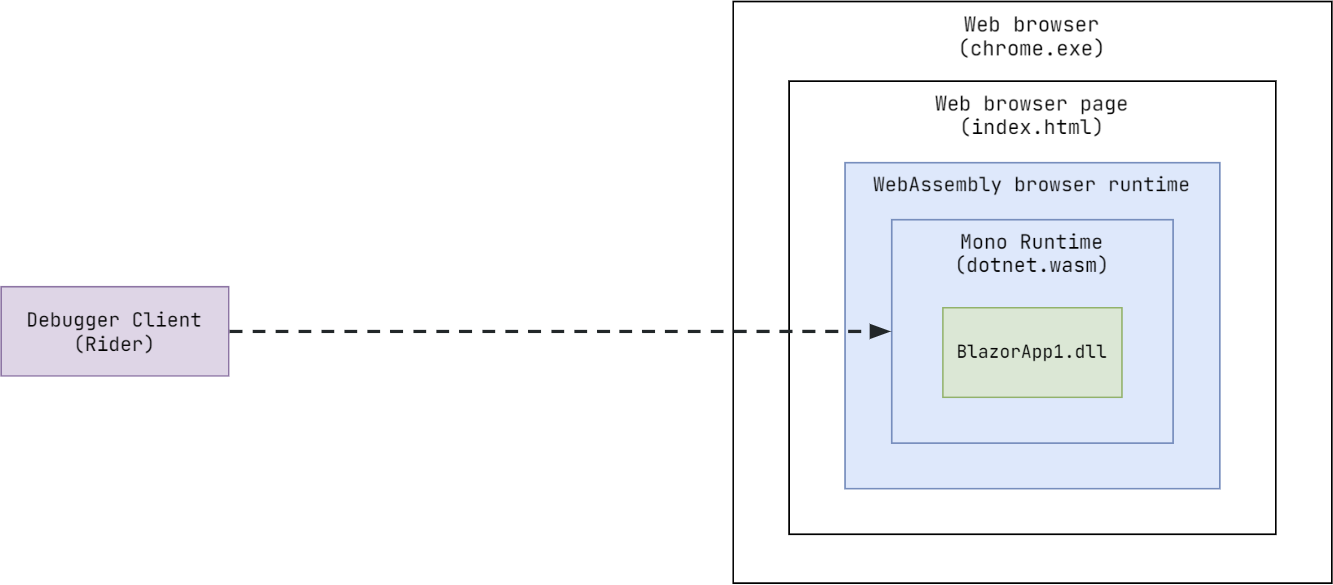
First of all, there’s a Chromium-based browser involved. The browser hosts the index.html page as a tab. This browser tab hosts a regular WebAssembly runtime that can execute special .wasm code. Meanwhile, the WASM runtime starts the Mono runtime, which can decode and execute .NET’s Common Intermediate Language (CIL) in the form of an assembly.
As part of this runtime, your application code is executed – the part that we’re interested in debugging. A rather complex onion-like architecture emerges, through which the debugger needs to be able to monitor the code execution process and receive events in the reverse direction, for example, when a breakpoint is hit.
After this short interruption, let’s look at how JetBrains Rider works with all of these!
The debug proxy
Luckily for us, there’s an existing mechanism for working with an architecture like we just described: the Mono Debug Proxy!
If you go back to the Blazor WASM process tree when running your application, you’ll see that it looks a bit different when you’re running the debugger through Rider. A new child process is started:
Rider.Backend.exe: …
└── winpty-agent.exe: …
    └── dotnet:
~/.nuget/packages/microsoft.aspnetcore.components.webassembly.devserver/7.0.5/tools/blazor-devserver.dll --applicationpath bin\Debug\net7.0\BlazorApp1.dll
        └── dotnet: exec
"~\.nuget\packages\microsoft.aspnetcore.components.webassembly.devserver\7.0.5\tools\BlazorDebugProxy\BrowserDebugHost.dll" --OwnerPid 16152 --DevToolsUrl http://127.0.0.1:64069
The last process in this tree launches the BrowserDebugHost.dll, which receives its parent process ID and a value for the DevToolsUrl argument. This URL is one of the key elements for making the debugger proxy work. Let’s add it to our diagram:
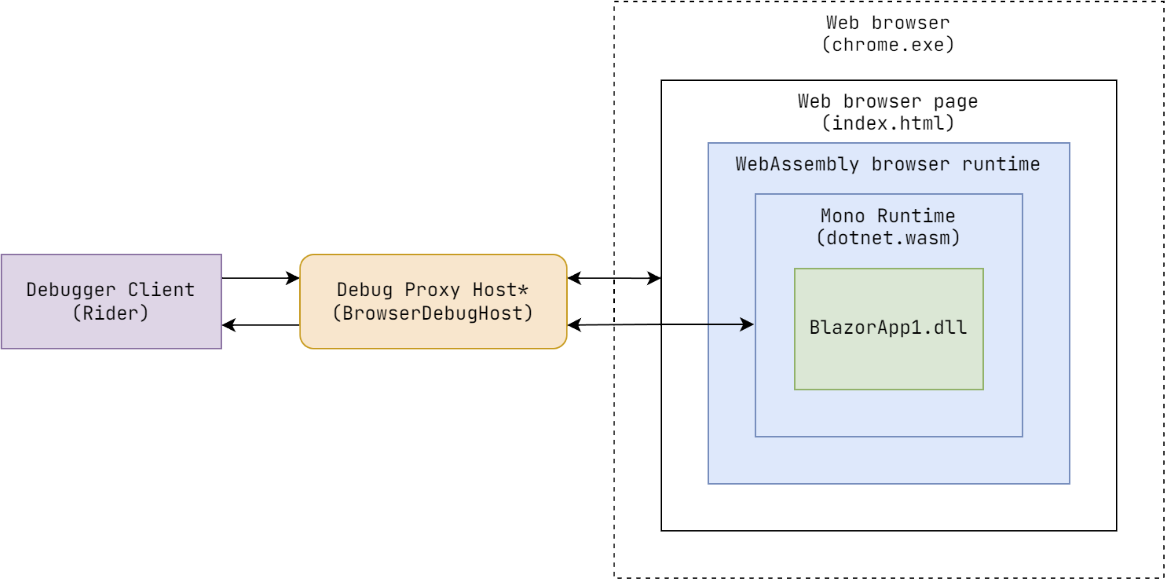
When the Debug Proxy starts, it uses the Chrom(ium) developer tools URL to retrieve the information it needs in order to work with the browser tab. This includes, for example, how to send and receive events from the browser and how to work with the Mono runtime that hosts your application. The Debug Proxy does a lot of heavy lifting for the debugger client, in our case JetBrains Rider, because now it only needs to work with one entity.
In other words, the debugger client (JetBrains Rider) does not work directly with the browser tab. Instead, it connects to the Debug Proxy, which serves as a communication layer between the browser, the debugger client, and the runtime.
As a debugger client, JetBrains Rider can now send and receive calls and events from the browser, for example downloading assets, navigating in the address bar, and so on. The Debug Proxy also listens for JavaScript events from Mono and can work with it through the .NET JavaScript API found in the dotnet.js file. Unfortunately, this API is currently undocumented, and changes quite often.
Time for some reverse engineering!
Connecting all the components: Rider, Debug Proxy, and the browser
To communicate with the Mono runtime running in the browser, JetBrains Rider, the Debug Proxy, and the browser need to communicate with each other. This communication starts with a handshake, ensuring all components know where the other components can be reached.
The handshake that establishes communication between all the components is the most complex and unstable process in the entire mechanism. Let’s start with a diagram so that you can follow along.
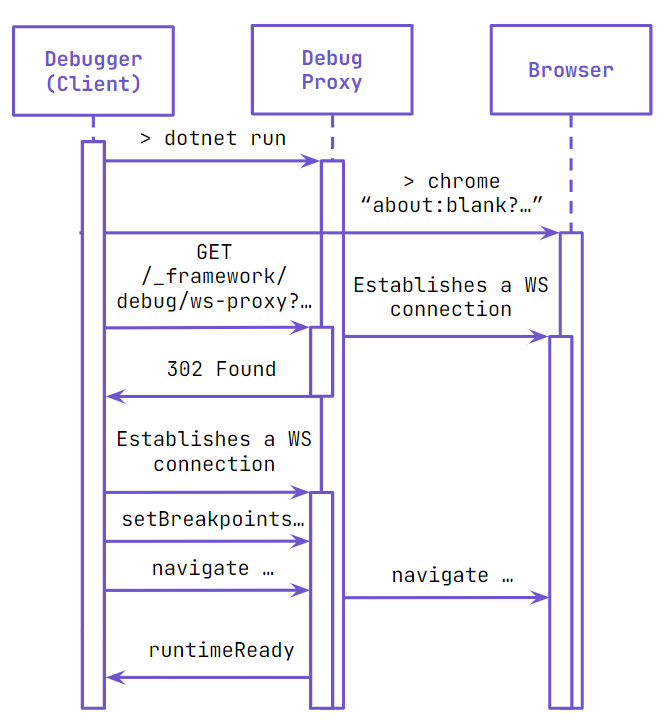
When you start debugging a .NET WebAssembly application, for example WasmApp1, the debugger will launch the WasmApp1 process using the DevServer or ASP.NET Core, depending on the hosting option. The Debug Proxy is also launched as a child process, thanks to the WebAssembly debugging middleware that is registered automatically as part of your application.
Next, a Chromium browser such as Google Chrome or Microsoft Edge is launched and instructed to open a special placeholder URL like about:blank?realUrl=.... The browser then writes its debugging port and path to a file in your user profile directory.
The debugger then constructs the debugger endpoint websocket URL based on the port and path from this file. It will then look like this: ws://127.0.0.1:{port}/{path}. In the next step, the debugger sends an HTTP GET request to a special endpoint – GET http://localhost:5170/_framework/debug/ws-proxy?browser=ws://127.0.0.1:{port}/{path} – which, as you can see, contains the generated websocket URL. The WebAssembly debugging middleware we discussed earlier passes this on to the Debug Proxy.
After that, the Debug proxy comes into play and initializes a WebSocket connection to the browser using the URL it received. Once connected, it opens a new proxy debugging endpoint and returns the URL to this endpoint with a 302 Redirect response.
Once JetBrains Rider receives the endpoint URL, which the Debug Proxy then returns, it creates a connection to it. And then, the real work begins!
When connected to the Debug Proxy, JetBrains Rider sends information about all breakpoints that were added by the user in the IDE’s editor. Remember, the browser is still open on a special empty page, so your application is not yet running. The Debug Proxy will keep track of these requests to create breakpoints and will apply them when the Mono runtime is ready to receive them. This approach ensures that a breakpoint on the first line of your Main method can be triggered, which might otherwise not be possible because, at this point, the runtime is already executing your application.
After the Debug Proxy knows about these breakpoints, JetBrains Rider triggers browser navigation to the actual application – yours! This starts the Mono runtime and makes sure your application is executed.
As a final step, the Debug Proxy finishes all activities related to activation of the runtime, loads the required assemblies, and sends a signal to JetBrains Rider that it’s ready for action!
The Chrome DevTools Protocol (CDP)
Browsers using the Chromium engine all implement the so-called Chrome DevTools Protocol (CDP). If you’ve worked with Selenium or other frontend test automation tools, you may have used it yourself. Through the CDP interface, you can do almost anything with the browser and pages – as long as you stay within the limits of the user’s security settings.
The CDP is well documented and versioned. Structurally, it consists of what are called domains, or modules, which in turn consist of types. Think of them like a structure or record that can transfer specific data. Some methods allow the debugger client to make calls into the Chromium instance, and events, where the debugger client can subscribe to calls from the browser into the debugger. The Debug Proxy can be considered a “virtual” Chromium browser, because it also communicates using the CDP.
Note: If you want to explore the CDP protocol in detail, check out the official CDP documentation or a simplified version. Since we had to reverse-engineer the DotnetDebugger, Mono, and Runtime domains of the CDP, we are hosting the CDP documentation for anyone who is interested in writing their own .NET WebAssembly debugger.
At the transport level, websockets are being used. The messages that flow over this socket are a variation on JSON-RPC 2.0, which is a format describing remote calls using JSON payloads. This format is also used in the Language Server Protocol.
There are three types of messages: requests, responses and events. Request and response messages from and to the debugger client (JetBrains Rider) are ordered by id, whereas events can be triggered at any point in time without strict ordering. Here are some example messages:
// request
{"id":10, "method": "Page.navigate", "params":{"url":"http://localhost:5170/"}}

// response
{"id":10, “result”: {"frameId":"…","loaderId":"…"}}

// event
{"method": "Network.requestServedFromCache", "params":{"requestId":"98279.21"}}
With CDP, it’s also possible to create sessions on a single connection, to control different browser tabs while re-using the websocket connection.
Targets are another supported concept. The debugger can attach to the browser and a page, but also to service workers, background pages, and so on.
.NET WebAssembly Chrome DevTools Protocol in Rider
Whew, what a title! Working with the CDP to interact with the Mono runtime running your WebAssembly application is great! However, we found that working with the protocol messages directly gets boring rather quickly. So, we built an abstraction that we can use in the JetBrains Rider code base!
Since several folks on our team may be interacting with the .NET WebAssembly debugger, we wanted to create a simple API that doesn’t require our entire development team to know about all of the details of the CDP protocol and other machinery we covered in this post.. Here’s an example code snippet of setting up the connection to the browser’s websocket URL, which abstracts much of the handshake we saw earlier in this post.
// Creating connection
var connection = new DefaultProtocolClient(new Uri("ws://localhost:5151"), logger);
await connection.ConnectAsync(cancellationToken);

// Sending commands
var response = await connection.SendCommandAsync(
    Domains.DotnetDebugger.SetDebuggerProperty(
        JustMyCodeStepping: true
    )
);

// Firing commands (when we're not interested in response)
await connection.FireCommandAsync(Domains.Debugger.StepOut());
The commands sent with this API correspond to methods in CDP terminology. We can send them and wait for a response or make a fire-and-forget call. The commands (methods), events, and types are generated from the JSON specification of the CDP.
In addition to sending messages, it is also possible to listen for events and create new sessions (called “scopes” in the API). We try to avoid using the exact CDP terminology because we will also extend this API to the Firefox Debugger Protocol in the future.
// Listening for events
pageClient.ListenEvent<Domains.Debugger.BreakpointResolved>(async e =>
{
    ResolveBreakpoint(e.BreakpointId.Value);
});


// Creating scoped clients (clients for specific sessions)
var scopedClient = connection.CreateScoped(sessionId);
Since methods must be ordered in the CDP, they are not sent directly. Instead, they are added to a queue. In a long-running task, they are sent with an incremental message ID. When sending, a TaskCompletionSource is created for the same message id, so that we can await the response to this message.
private readonly BlockingCollection<ProtocolRequest<ICommand>> _outgoingMessages = …

public async Task<TResponse> SendCommandAsync<TResponse>(ICommand<TResponse> command,
  string? sessionId = null,
  CancellationToken? token = default) where TResponse : IType
{
  var id = Interlocked.Increment(ref _currentId);
  var resolver = new TaskCompletionSource<JObject>();
  if (_responseResolvers.TryAdd(id, resolver))
  {
    await FireInternalAsync(id, GetMethodName(command.GetType()), command, sessionId);
    var responseRaw = await resolver.Task;
    var response = responseRaw.ToObject...
    return response;
  }
  throw new Exception("Unable to enqueue message to send");
}

private async Task FireInternalAsync(int id, string methodName, ICommand command, string? sessionId)
{
  var request = new ProtocolRequest<ICommand>(id, methodName, command, sessionId);
  if (!_outgoingMessages.TryAdd(request)) throw new Exception("Can't schedule outgoing message for sending.");
}
A separate long-running task also listens for incoming messages from the browser. These can be both events and responses to a message that was sent earlier. For events, the appropriate delegate is invoked. In the case of responses to messages, we retrieve the corresponding TaskCompletionSource created when sending the message, and depending on whether it is a result of an error, we set the TaskCompletionSource status.
When setting breakpoints in the CDP, we do so based on the file name. The runtime loads different assemblies and source maps from debug symbols one by one, and as soon as it finds a candidate that matches the file name pattern, a BreakpointResolved event is fired. JetBrains Rider has to respond to it as quickly as possible to make sure you don’t see a grayed-out breakpoint in the editor.
A queue is also used to send the commands to create or remove breakpoints, due to the specifics of Rider’s debugger infrastructure.
Hot reload with .NET WebAssembly
With hot reload, you can make changes to code while debugging and apply those changes to your application without restarting it. While JetBrains Rider supports hot reload for many application types, it does not (yet!) support hot reload for .NET WebAssembly.
The way hot reload would work with .NET WebAssembly is by making use of the Edit-and-Continue (EnC) functionality in the runtime.
Note: If you want to learn more, check out this post about how .NET hot reload works in Rider.
The Debug Proxy has added support for EnC in .NET 7. With that now available, consider this short section as a confirmation that we are indeed working on it!
Conclusion
Although we did not have time to go over all debugger-related topics such as evaluating expressions, watches, and working with call stacks, we do hope this blog post gave you a solid rundown of how the .NET WebAssembly debugger works in JetBrains Rider!
Want to join our JetBrains Rider or ReSharper team and help us build the best .NET developer tools on the market? We’re hiring!
Photo by Clayton Cardinalli on Unsplash
Subscribe to a monthly digest curated from the .NET Tools blog: