
Those who have read some of my previous performance-focused blog posts will know that I use the dotMemory product from JetBrains when working on code optimisations.
In this post, I want to demonstrate a really handy, but somewhat underutilised feature, to automate the collection of snapshots in a repeatable way. I use these steps quite often during local development. They can even be applied to perform profiling and snapshot collection as part of a CI pipeline. I have covered the profiler API in a previous post, but I wanted to revisit it as part of a new mini-series, taking some of the details a little further.
Full disclosure: I am a JetBrains Community Contributor and as such, I am provided with free licenses to their software, but I have been using their tools long before that.
Using dotMemory from JetBrains we can begin profiling a .NET application to collect fine details about all allocations that occur during the profiling session. We can also control the creation of snapshots from the dotMemory UI that can be used to compare allocations between two time windows. While this itself is useful and a common feature of memory profilers, one downside is that we need to be present during the profiling session to control the creation of these snapshots at the correct times. When profiling longer workflows such as a request handled by ASP.NET Core, this is fine as we can simply snapshot before visiting a URL and again after to gather the snapshots at the right places. When using the profiler during optimisation work, it can be hard to define when to take the snapshots for shorter workloads. One solution is to include some temporary breaks in the code, perhaps using Console.ReadKey() to pause progress. This allows a snapshot to be taken before continuing. This works but requires redundant code to be added purely to control profiling. A better approach is to automate this work.
The scenario I will use for demonstration purposes is from a real and recent piece of work I undertook on the Elastic APM Agent for .NET. Our Elastic APM .NET Agent collects and sends metrics from any registered providers on a periodic basis. By default, we check for new samples every 30 seconds. This makes the code in these providers a good place to look for reductions in allocations which will occur frequently for the lifetime of the application.
In a future post, I will describe the full optimisation workflow, but for now, assume I have benchmarked my code and identified some possible areas for improvement. My goal in this scenario is to understand the actual objects being allocated when samples are produced.
To automate the profiling of a codebase, we can begin by creating a console project in our solution that we will use specifically for profiling. In this case, I created a new .NET 7 console application named Elastic.Apm.Profiling. In order to call the code that I plan to benchmark I need a few project references from the current solution.
<ItemGroup>
  <ProjectReference Include="..\..\src\Elastic.Apm\Elastic.Apm.csproj" />
  <ProjectReference Include="..\..\test\Elastic.Apm.Tests.Utilities\Elastic.Apm.Tests.Utilities.csproj" />
  <ProjectReference Include="..\..\test\Elastic.Apm.Tests\Elastic.Apm.Tests.csproj" />
</ItemGroup>
The above includes the Elastic.Apm library which contains the code I want to profile. The two test projects include some utilities and helpers used during testing that I want to repurpose to set up before profiling.
In order to support automation of memory collections and snapshots, we will reference a NuGet package provided by JetBrains.
<ItemGroup>
  <PackageReference Include="JetBrains.Profiler.Api" Version="1.4.0" />
</ItemGroup>
The JetBrains.Profiler.Api contains APIs we can use to control profiling sessions using .NET code. This is extremely useful since we can then automate and precisely control a repeatable profiling session.
The provider I wanted to profile is responsible for collecting memory statistics from the Linux cgroup virtual filesystem. The exact details are not too important but the code essentially reads some text data from various files, extracts some values, and uses them to populate the metric set samples. I already have some ideas for potential ways to optimize the code to avoid some allocations I could spot from a quick review. However, I really wanted some memory snapshots to be sure I was aware of all allocations.
It’s worth pointing out that while cgroups are a Linux feature, the virtual filesystem is really just a set of files at known paths that we can read. In our codebase, we support a testable version of the cgroup provider which can be tested on both Windows and Linux under controlled conditions. We achieved this by creating a temporary directory populated with some sample cgroup files in the correct subdirectories. We can then execute the provider against those test files on both Windows and Linux. As we’ll see, some of the allocations we observe occur purely because of this test system and the fact that I do my initial profiling on my development laptop which runs on Windows. In a future post, I will demonstrate how to collect snapshots on Linux with a few basic additional steps. For this post, we’ll focus on how to automate the profiling session in general and run the profiling on Windows.
Within my program file (using top-level statements) my entire profiling code ended up being fairly straightforward. I’ll share the code and then we can step through what it does.
using JetBrains.Profiler.Api;
using Elastic.Apm.Helpers;
using Elastic.Apm.Tests.Utilities;
using static Elastic.Apm.Metrics.MetricsProvider.CgroupMetricsProvider;
using static Elastic.Apm.Tests.TestHelpers.CgroupFileHelper;

var paths = CreateDefaultCgroupFiles(CgroupVersion.CgroupV1);
UnlimitedMaxMemoryFiles(paths);

// WARMUP

var sut = TestableCgroupMetricsProvider(new NoopLogger(), new List<WildcardMatcher>(), paths.RootPath, true);
foreach (var metricSet in sut.GetSamples())
	foreach (var _ in metricSet.Samples)
	{
	}

// PROFILING

MemoryProfiler.CollectAllocations(true);
MemoryProfiler.GetSnapshot("Before GetSamples");

foreach (var metricSet in sut.GetSamples())
	foreach (var _ in metricSet.Samples)
	{
	}

MemoryProfiler.GetSnapshot("After GetSamples");
MemoryProfiler.CollectAllocations(false);
After using declarations, the first lines of code set up the fake cgroup files within a temporary directory. This code is repurposed with the test helpers used during unit testing.
Next, I perform a basic warmup of the code I plan to profile. The reason I do this is to ensure that my snapshots capture the regular allocations that occur, and not any one-time allocations that may occur the first time GetSamples is called. This code simply creates an instance of the CgroupMetricProvider and then calls GetSamples on that instance. The static TestableCgroupMetricsProvider method is an internal factory method that can create a provider that knows to use a specific root path prefix for the cgroup paths. This allows the provider to work with controllable and repeatable inputs. The final argument configures the provider to ignore the fact we are on Windows which would otherwise result in a log entry before an immediate exit from the method.
You’ll notice that I enumerate any metric sets returned by GetSamples with a foreach loop. Within that loop, the code further enumerates the samples. As both the GetSamples method and the Samples property return IEnumerables, this ensures that we actually access them and any deferred allocations then occur.
Now we get into the profiling code. By default, the profiler will attach in sampling mode to the application when using the profiling APIs to control the session. When sampling is used, the profiling overhead is low, but we get limited data for every 100KB of allocations. For our use case, we want to capture full allocation data.
Before we perform the work we wish to profile, the call to MemoryProfiler.CollectAllocations(true) is used to switch to full allocation tracking. This has more overhead on the profiled application but allows us to collect all allocations as they occur, including the stack trace of their creation.
Next, we create a snapshot using MemoryProfiler.GetSnapshot(“Before GetSamples”). We do this before executing the code we are about to profile so that we have a point of comparison. We can pass through a string to name the snapshot, which is useful later when we review the profile session workspace in dotMemory.
The next lines of code repeat the call and enumeration of GetSamples. We no longer initialise the CgroupMemoryProvider as we are not interested in the allocation overhead of its constructor. The code concluded by getting another snapshot and then ending the full memory collection. This final line is not strictly necessary in this example, but a good practice nonetheless.
With our profiling code complete, we can proceed to build the project. It’s important to create a release build so that we have a representative measurement of the code used in production.
We’re now ready to execute the profiler. In this post, we’re going to do this manually by loading the dotMemory application and using the UI. In a future post, I’ll discuss how we can use the dotMemory command-line tool in a future post to automate this step for CI scenarios.
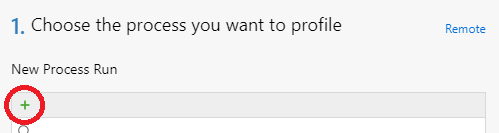
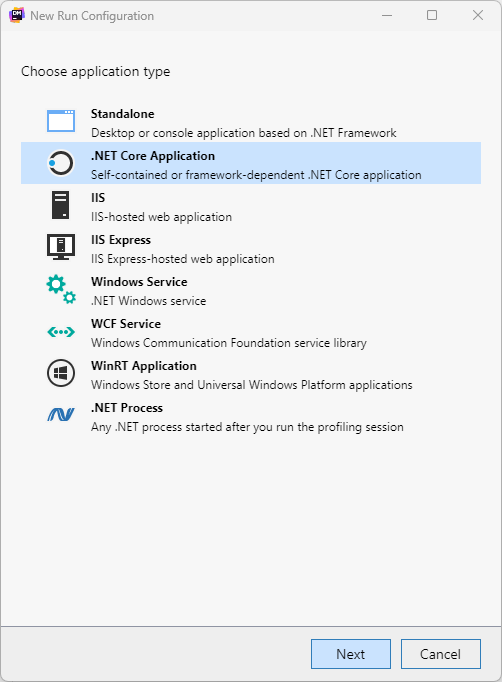
After loading dotMemory, we need to configure a process to run during profiling. We can add a run configuration and choose the .NET Core application type. We must provide the path to application, in this example, the Elastic.Apm.Profiling executable from the bin/Release folder is our target.
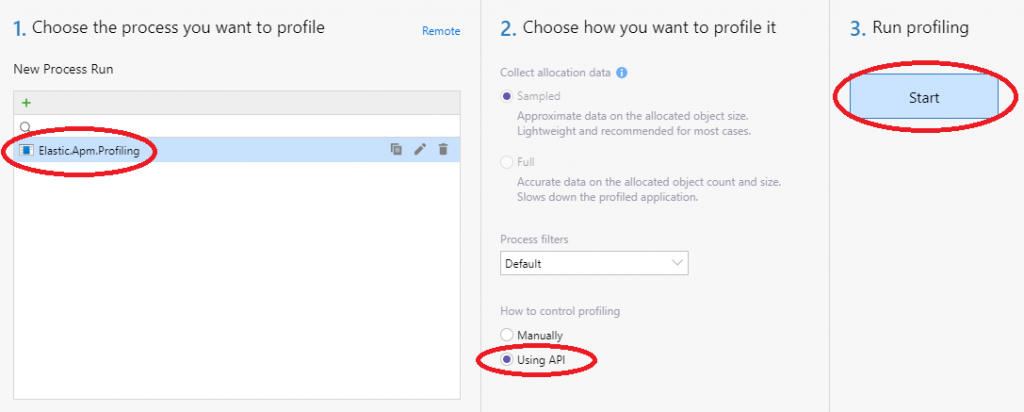
With the process configured, we can choose how to profile the application. We’re using the API so we’ll select that option. We’re now ready to click the Start button to begin profiling. dotMemory will now execute our profiling code and the profiler API will trigger our collection and snapshots.
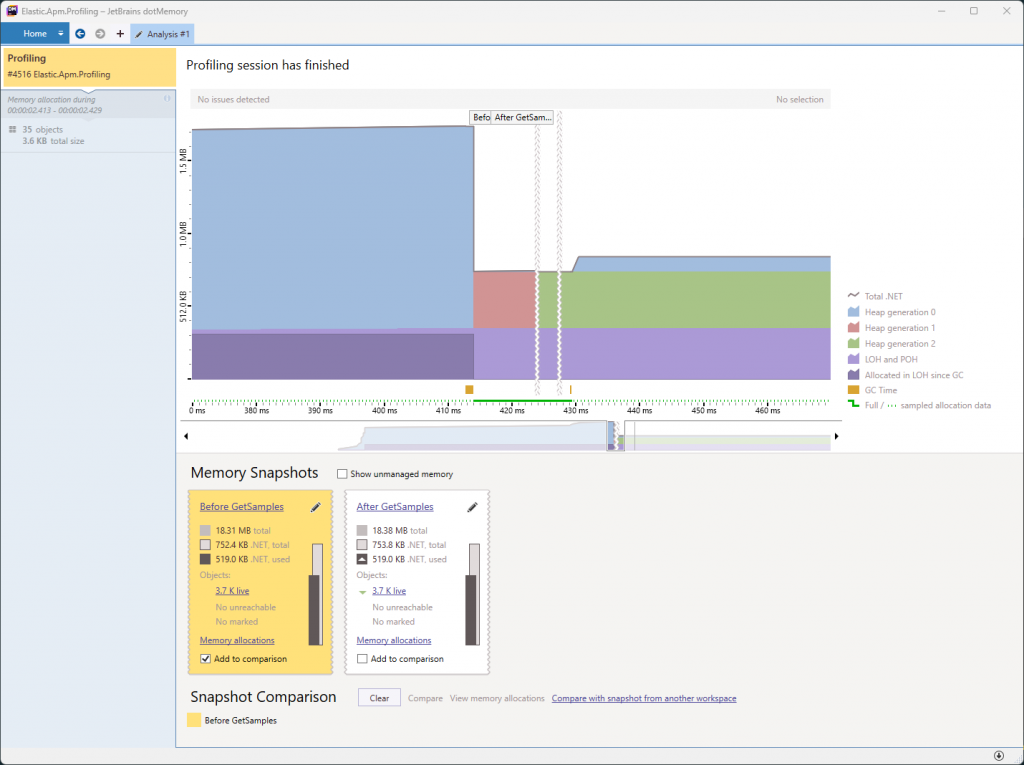
Once this is complete, we have a chart of the memory consumption captured during the profiling session. The section with the solid green bar beneath it is the brief period where we captured full collections. Within that time range, we can see the points where the two snapshots were taken.
Below the chart, we see the named snapshots that we created using the profiler API. From here, we can begin a comparison of the allocated objects and all allocations that occurred.
Analysing the data captured during our profiling session is beyond the scope of this blog post. I will cover some specifics around optimising the GetSamples allocations in a future post. I also plan to demonstrate how we can capture profiling data from Linux.
Have you enjoyed this post and found it useful? If so, please consider supporting me: